3. Results
3. Results
The results of our experiment are as shown below:
Figure 2: Graph of the temperature against time for 0.00, 0.05, 0.10 g/ml salt concentration
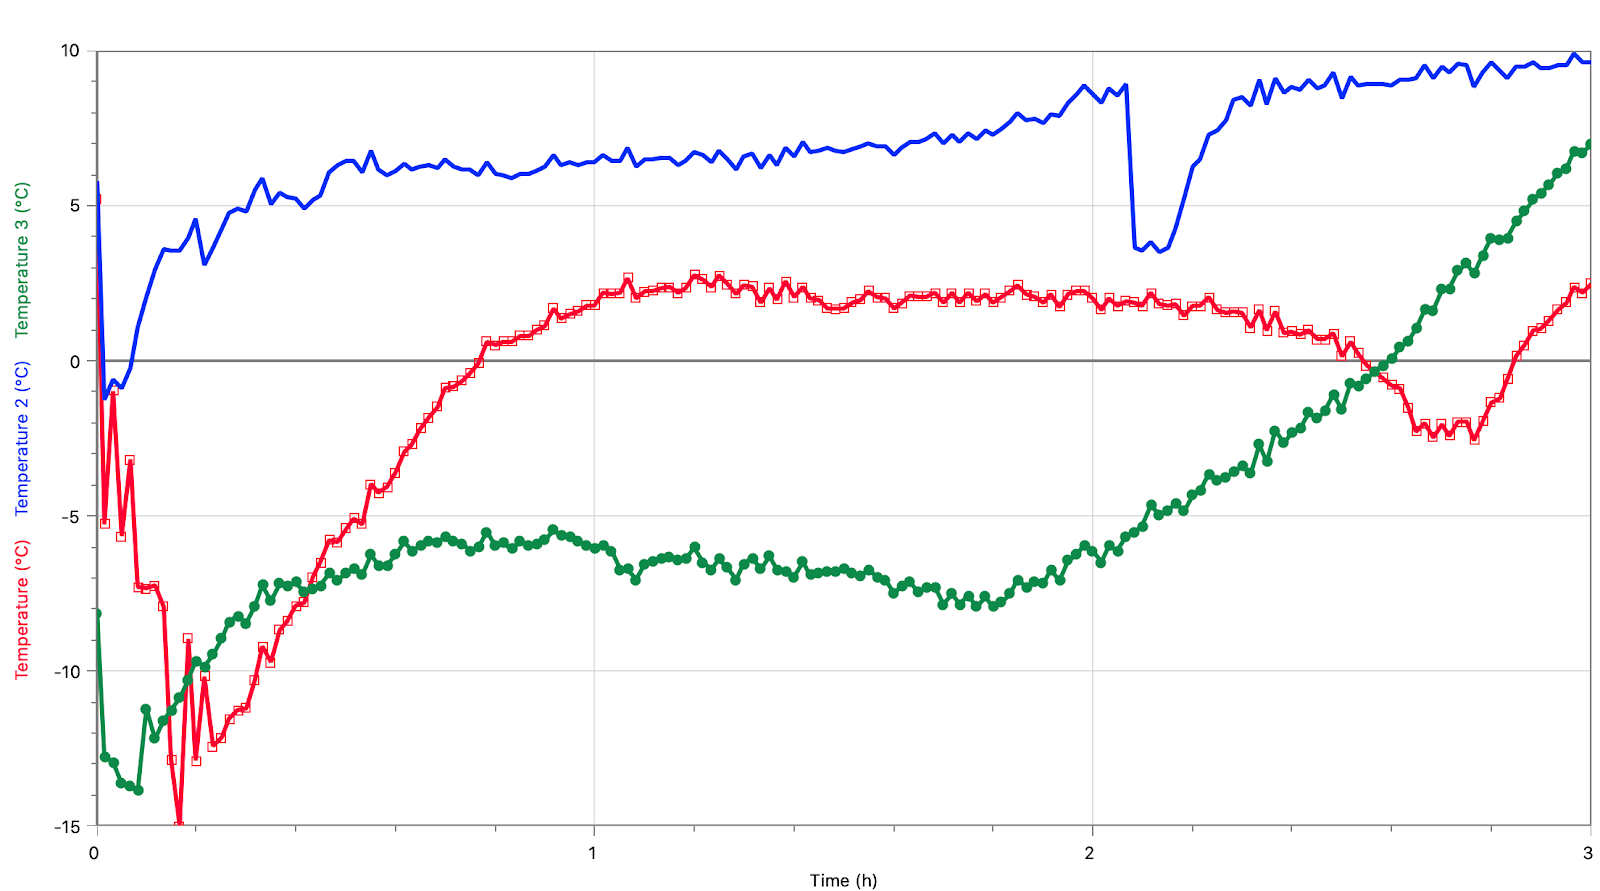
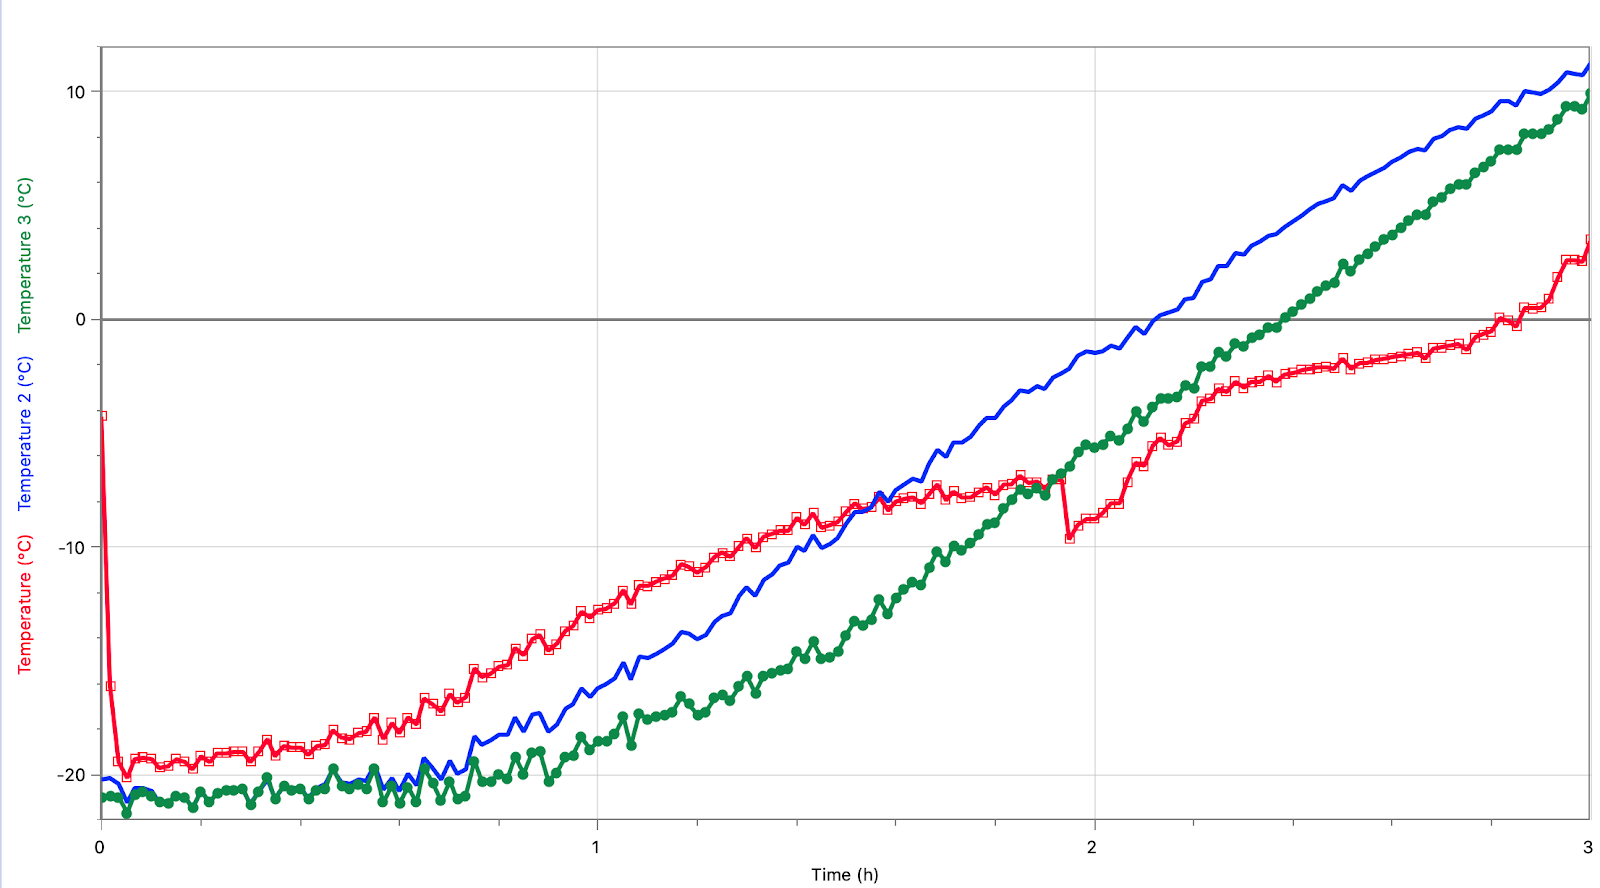
Figure 3: Graph of temperature against time for 0.15, 0.20, 0.25 g/ml salt concentration
Comments
Post a Comment