4. Discussion
4. Discussion
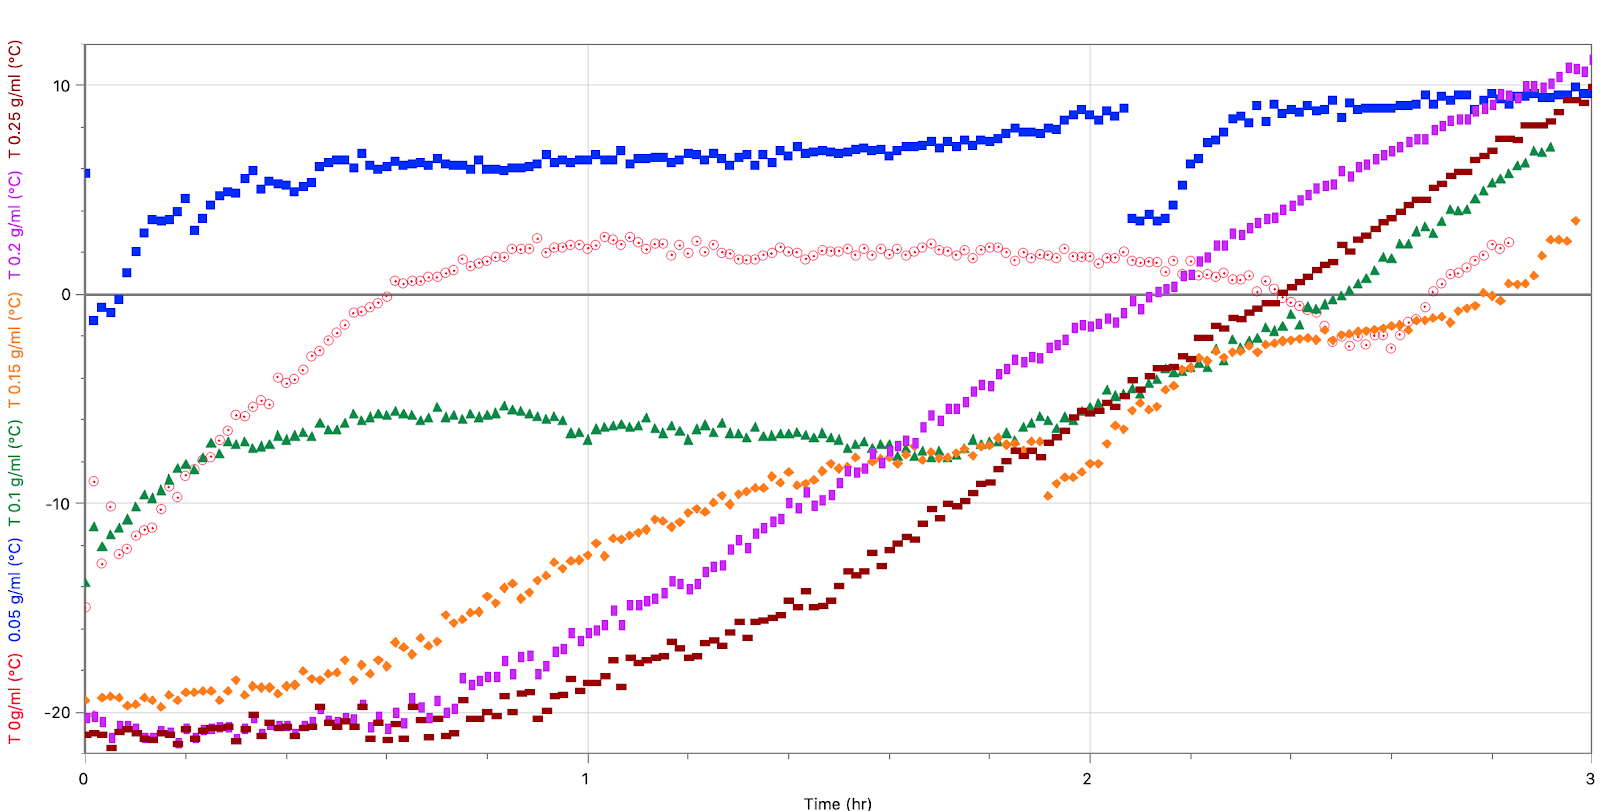
Fig 4: Graph of temperature against time for all six salt concentration
4.1 Key findings & Analysis of results
Table 2: Summary of melting point for all six salt concentrations
There are 2 anomalies in the results. Concentration 0.00 and 0.05 g/ml have a melting point above 0°C.
4.2 Explanation of key findings
The one with the salinity of 0.05 ( 10g of salt ) is shown to strangely decrease dramatically in temperature at around 2.1 hours, which is abnormal and inaccurate, and the frozen water with no salinity has a consistent length of temperature flow in the graph that is shown as strangely above 0 degrees, as fresh water is supposed to have the melting point of 0 degrees, since there is no salt to break the h-bonds between h2o molecules that can affect melting point of ice.
4.3 Evaluation of Hypothesis
Table 3: Table of melting point temperature readings against the amount of salt concentration/ salinity
Our hypothesis is that the higher the amount of salt concentration/salinity, the lower the temperature melting point is. It is correct at the point where the frozen water with the salt concentrations of 30g, 40g and 50g all have melting points of lower temperature than the ones with 0, 10g and 20g salt concentrations.
We can conclude that although there are differences between our melting point with the hypothesis, the general trend as shown in Fig. 5 is correct.
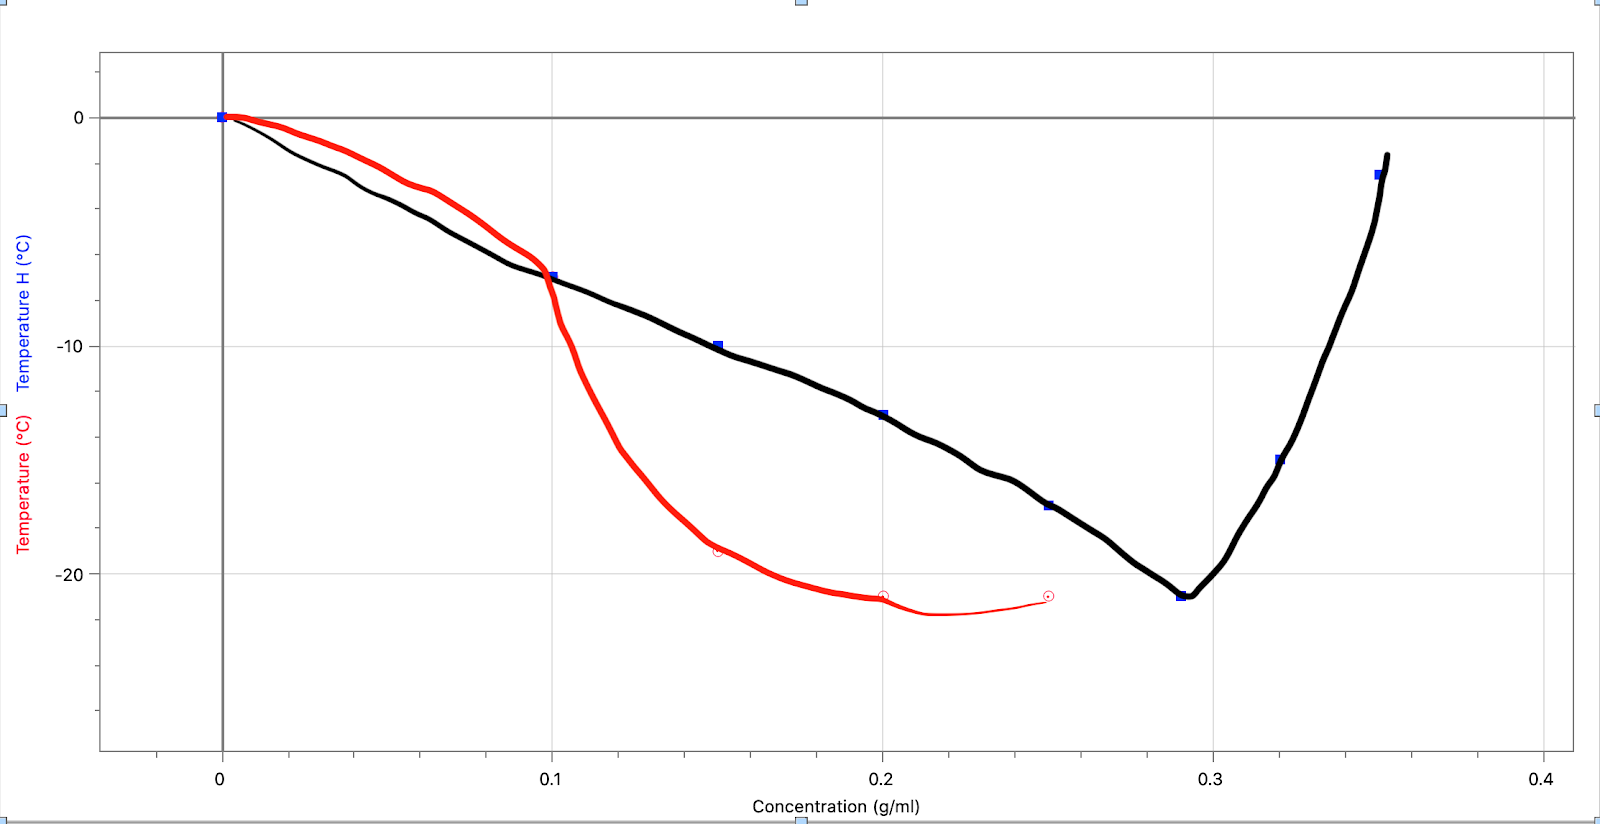
As shown in the graph above, the frozen water with the salinity of 0.1 has the exact same melting point temperature as the hypothesis’ ones. However, the frozen waters with salinities of 0.15, 0.2 and 0.25, have way lower melting points and more drastic drops in temperature compared to the hypothesis’ ones, while having a difference in the melting points’ temperature of up to 9 degrees. This is due to the usage of tap water, which may have dissolved solids that further decrease the melting point temperature of the frozen waters.
4.4 Limitations and Areas for improvement
One limitation is the way of the set up for our experiment, referring to how technically, the probes can’t exactly measure the frozen water’s temperature. Because as straws are an insulator of heat, the probe would be less sensitive to the temperature of the frozen water, which can cause inconsistencies in the temperature as the probe finds it harder to get sensitive towards the frozen water’s temperature and the temperature starting points will be affected too. Not only that, but the blue tack would allow the probe to measure only the surface of the blue tack that has been affected by the temperature of frozen water. So we had the idea of removing the hot glue/ blue tack feature of the straw that prevents water from going in, so that when water goes in and we remove the straw, the probe can be submerged completely.
Second limitation is using tapped water instead of distilled, clean water, which means that tapped water may have dissolved solids that affect melting points of ice.
For improvement, we should have predicted the outcome of a difficult setup like this and not waste time on things like attempting to break a hole in the frozen water to remove the straws and submerge the probe, which affects the temperature flow recorded in the graph. We shouldn’t have used tapped water which would contain dissolved solids that affect melting points of ice.
Comments
Post a Comment